In brief – it’s about using IT strategically and tactically to make government more efficient, transparent and engaging.
Of course this doesn’t begin and end with the technology – there needs to be deep-rooted cultural shifts and good IT literacy across a public service to realise the benefits from IT.
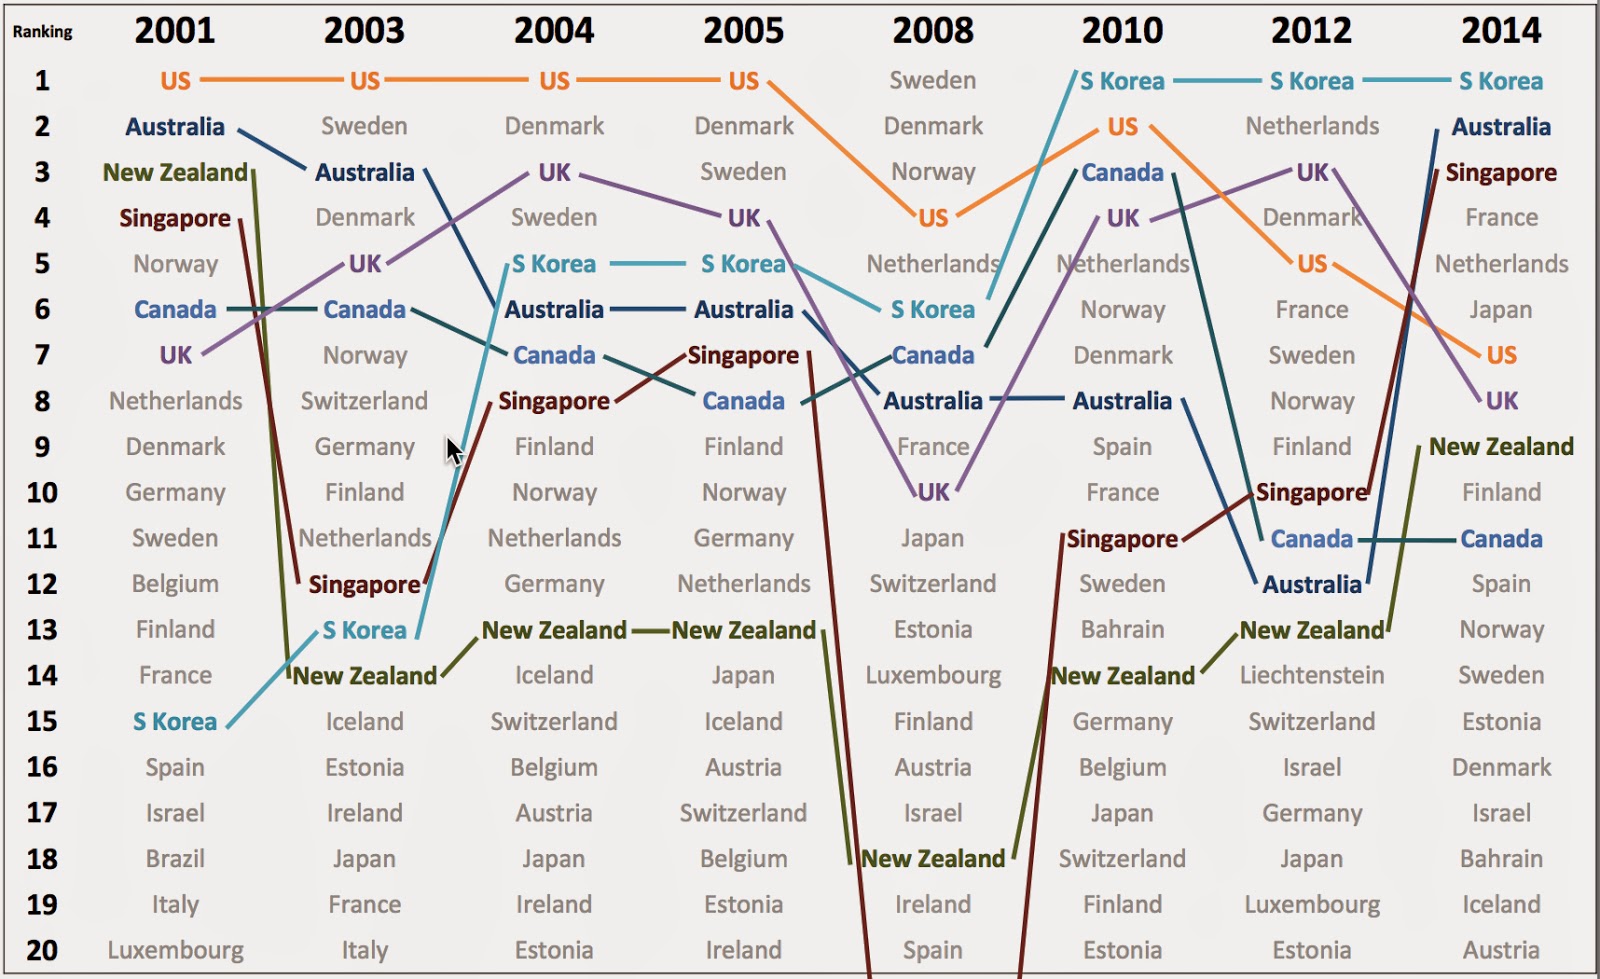
Internationally the UN has been reporting on this through a series of eGovernment development studies since 2001, tracking the performance of 193 nations (click on the images to enlarge them).
| UN e-Government development index top 20 nations for 2001-2014 (click to enlarge) |
I’ve reviewed the top twenty rankings for every study (2001 to 2014), and found some interesting stories in the trends – particularly amongst the countries highlighted in the image below.
 |
| Country trends in the UN e-Government development index top 20 nations for 2001-2014 (click to enlarge) |
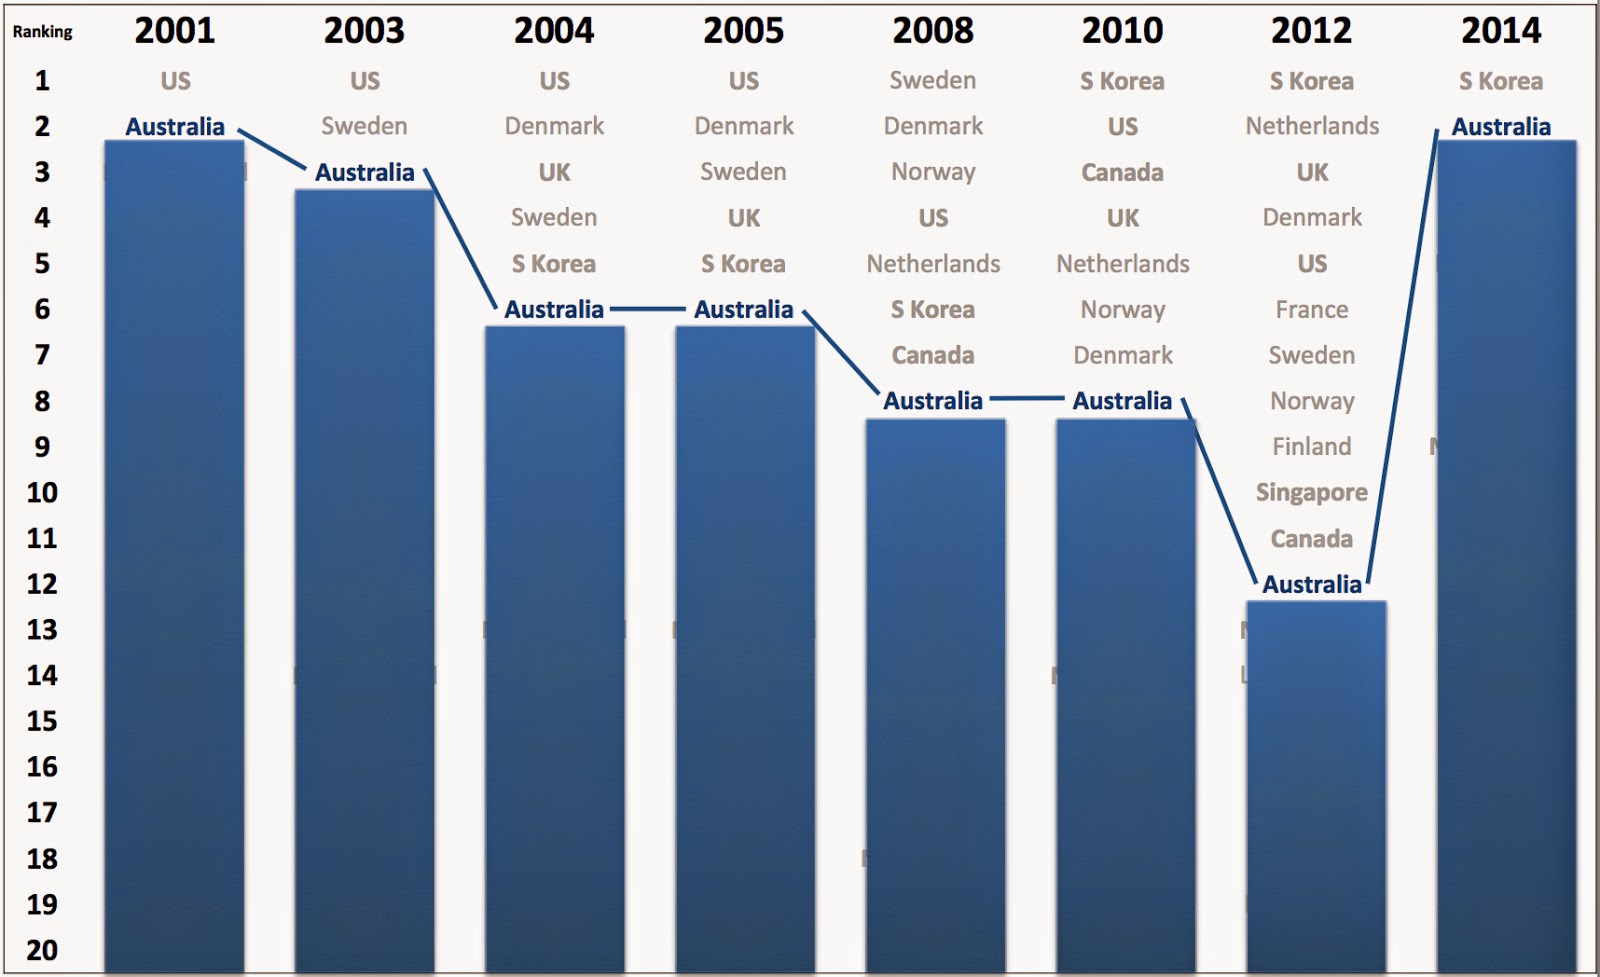
Australia has consistently ranked extremely well in the e-Government development index. We’ve always been in the top twenty nations, and only once slid below 10th position. However we’ve been in gradual decline, from 2nd in 2001 to 3rd in 2003, then 6th in 2004 and 2005, down to 8th in 2008 and 2010 and 12th in 2012.
This turned around in the 2014 study, where Australia leapt ten positions to 2nd place (see chart below).
This is an amazing turnaround, particularly given the e-Government development index is a relative measure of country performance – countries are continually improving their IT strategy and implementation approaches, so a nation must continually improve performance just to hold its position against other contenders.
It’s a huge testimonial to the work the Australian public service and government have done over the last four years to change how IT is viewed, structured and implemented within agencies. We’ve not only held our own, but leapt ahead of ten other nations.
 |
| Australian performance in the UN e-Government development index for 2001-2014 (click to enlarge) |
Some of our close neighbours have also done well.
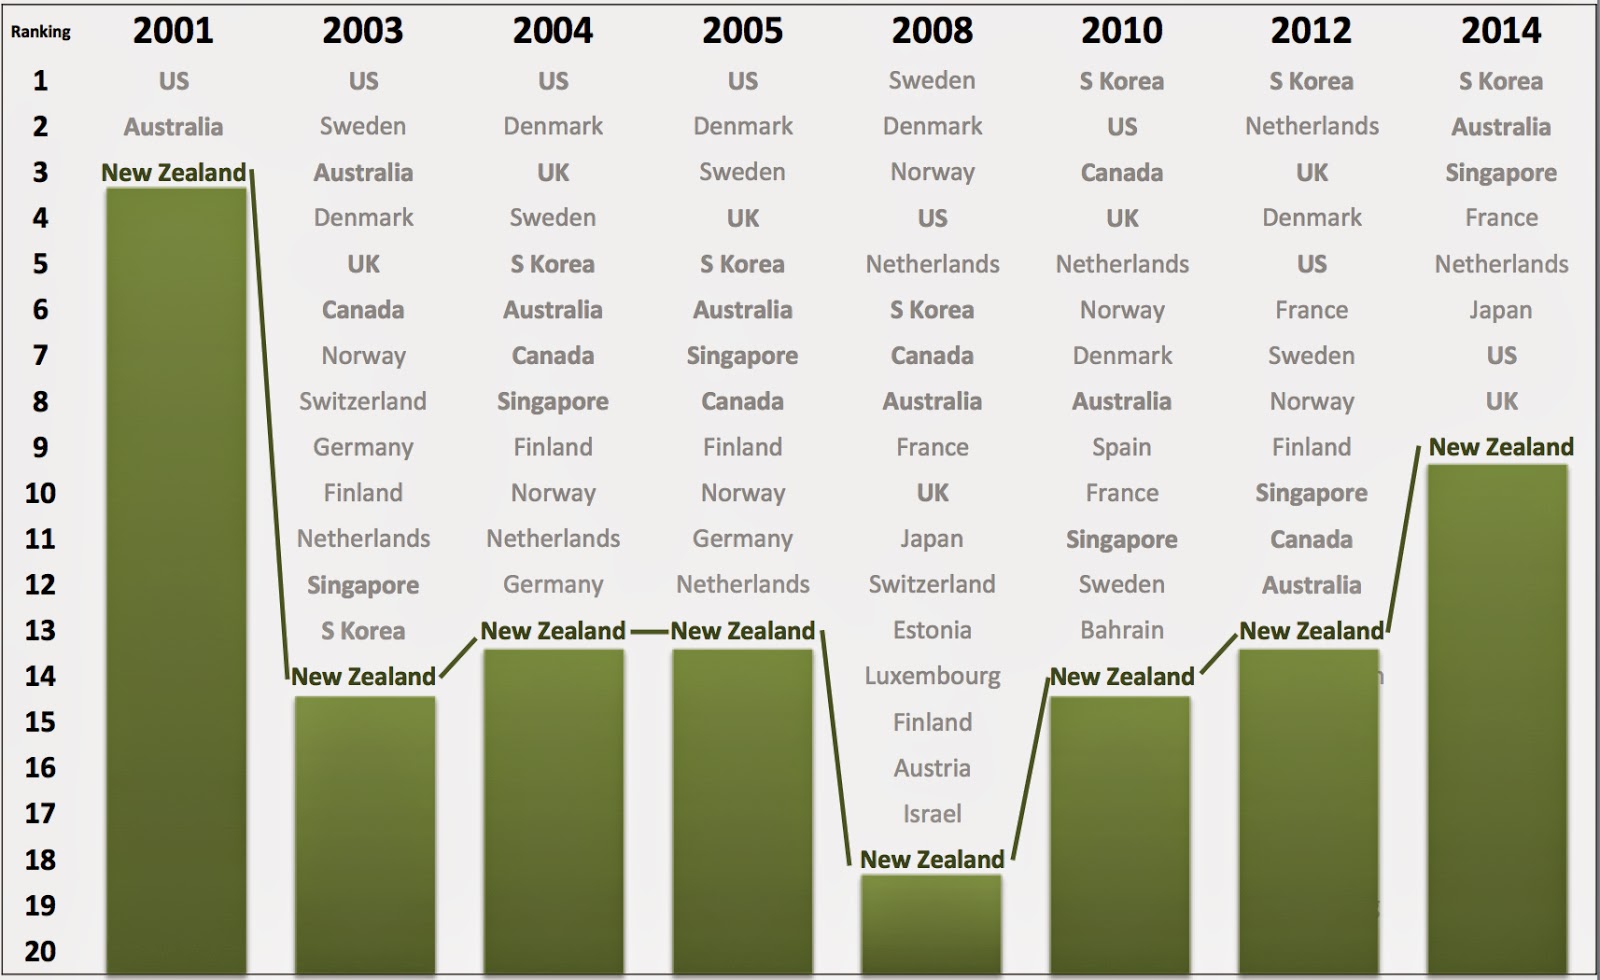
New Zealand has consistently been in the top twenty, albeit never overtaking Australia. They’ve also begun recovering in the rankings after a long period of time languishing in 13th to 14th position, returning to the top 10 in 2014 with 9th position.
Hopefully the work going on now in Wellington will help New Zealand to cement a place in the top ten for years to come.
 |
| New Zealand performance in the UN e-Government development index for 2001-2014 (click to enlarge) |
Singapore ranked 4th in 2001, however had a mixed performance for a number of years – even sliding out of the top twenty in 2008 to 23rd place.
Since then the country has achieved an amazing turnaround, and in the latest study ranks 3rd, just behind Australia (see red columns on the chart below).
South Korea, on the other hand, has been a consistent achiever over the last fourteen years. They started out in 15th position in 2001 and have increased or maintained their position in every study, except in 2008, when they dropped from 5th to 6th position.
However they recovered quickly, achieving the number one spot in 2010 and holding it ever since (see blue columns on the chart below).
From my experience with South Korea, the country has undertaken an extensive program of retraining public servants and embedding IT thinking into how they manage government. This is a significant advantage over countries that haven’t yet fully understood the importance of this cultural shift in thinking and how it plays out when implementing technology.
 |
| Singaporean and South Korean performance in the UN e-Government development index for 2001-2014 (click to enlarge) |
 |
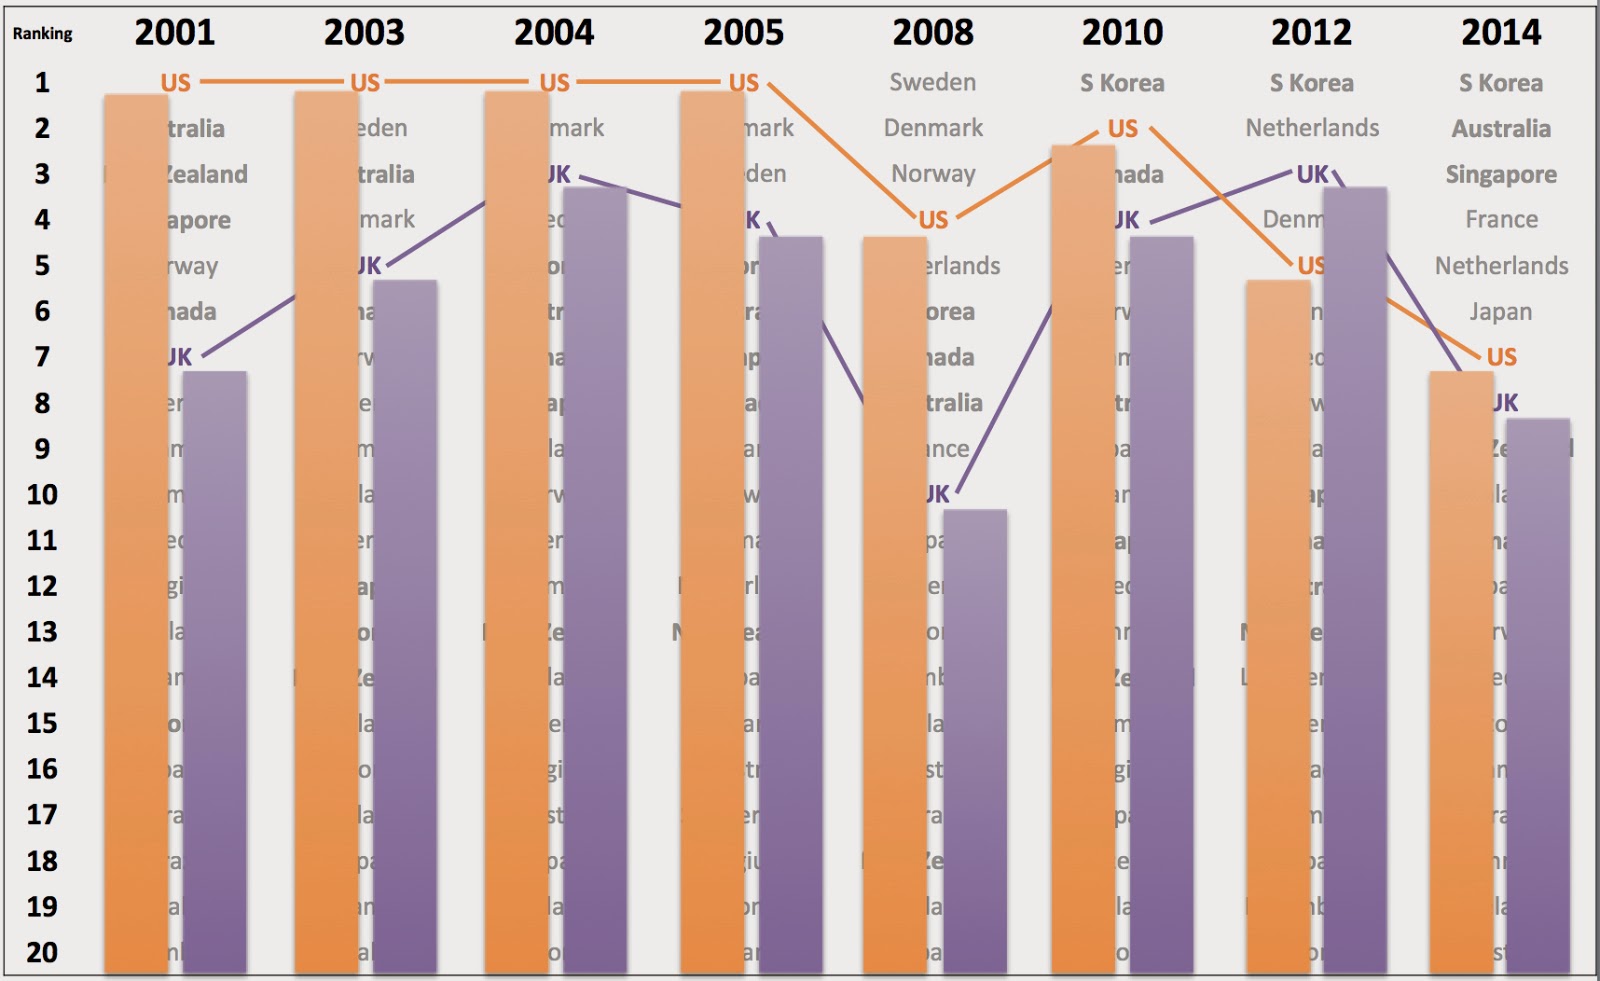
| US and UK performance in the UN e-Government development index for 2001-2014 (click to enlarge) |
Asia-Pacific now dominates the top 10
One of the most exciting things for me in the latest 2014 e-Government development index is the composition of the top ten.
Back in 2001, of the ten nations with the highest eGovernment capability, five were in Europe, two in North America, and three in Asia-Pacific (Australia, New Zealand and Singapore).
Asia-Pacific never had more than three countries in the top ten until the latest study, and regularly had less, two or even one country. Europe dominated, with between five and seven countries consistently in the top ten.
However in 2014 the ratio shifted.
Five countries from the Asia-Pacific region reached the top ten nations for the e-Government development index – South Korea, Australia, Singapore, Japan and New Zealand.
This included the top three positions (held by South Korea, Australia and Singapore).
This is a major achievement for our region of the world and reflects the global shift occurring as Asia-Pacific nations take on more of a global leadership role.
I expect to see this continue, with more Asian nations emerging as leaders in the egovernance space.
What this also says is that Australia needs to pay more attention to countries in our neighbourhood as they progress on their eGovernance journeys – we can both provide a great deal of support and learn a great deal from what our neighbours in Asia are doing.
Composition of the top ten by continent by study
2001: Europe: 5, North America: 2, Asia-Pacific: 3
2003: Europe: 7, North America: 2, Asia-Pacific: 1
2004: Europe: 5, North America: 2, Asia-Pacific: 3
2005: Europe: 5, North America: 2, Asia-Pacific: 3
2008: Europe: 6, North America: 2, Asia-Pacific: 2
2010: Europe: 6, North America: 2, Asia-Pacific: 2
2012: Europe: 7, North America: 1, Asia-Pacific: 2
2014: Europe: 4, North America: 1, Asia-Pacific: 5


Leave a Reply
You must be logged in to post a comment.