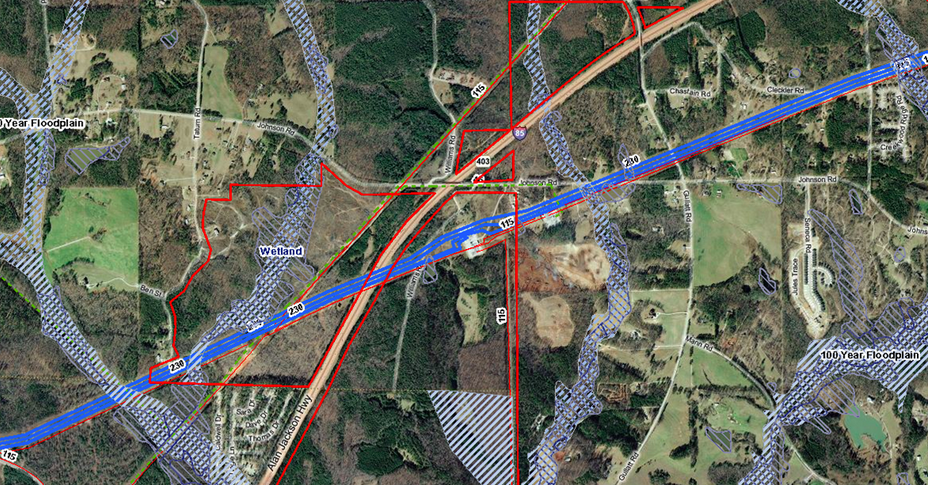
After millennia, now most people are drawn to “GPS,” or “Google Maps,” and rely on navigation to drive, to hike, to find a restaurant, to catch fish, and more. Such interest and dependence on geospatial information systems’ data creates a neologism of “a Google Map” or a “GPS Map,” but neither are maps as we geographers habitually think. Humanity has taken about 2,500 years to get to this point: the invention of geometry, trigonometry, clocks, printing press, perfection of navigation, mapping software, remote sensing, and geo-positioning systems have been required. But what is geospatial data?
In practice, IT people and “GIS” people sometimes butt heads over whether “GIS” is or is not based on a special type of data or system. In addition, there is always debate about whether geospatial data and analysis belong to the IT or the “business” side of the house or some independent office. Geo-spatial data is so weird that GPS is measured by time and calibrated to represent distance and direction. GIS (space) and GPS (time) have carried on a sibling rivalry for centuries trying to dominate our ways of conceiving the world and our experiences.
Yes, it is different: Without getting into the technical details of geography and cartography, there are some basic concepts. The primary concept is that of ‘layers” of geographic representation. Geometrically speaking, these are points, lines, and polygons: if you want to remember high school plane geometry class. Remember “x” and “y,” well there is a “z” too that represents height. There is an order to how they are shown; polygons on the bottom, lines in the middle, and points on the top. For example, States are shown as polygons, streets as lines, and the Washington Monument as a point. All maps are representations of the “real world,” and being representations they necessarily are not perfect. All maps and computer-based mapping software inherently distort area, distance, direction, area even when pinned to longitude and latitude. Mathematical calculations and instrumentation have been worked on for millennia to overcome those distortions even if they are a matter of centimeters’ difference. There are “vector” data types and “raster” data types. Vector data draws those geometric figures. Raster data may be pictures or thermal reflection or even laser-based recorded points. For raster data, think of the satellite imagery under on-line mapping applications. Resulting images and measurements of heat and light of wildfires or crops would be raster data too. All have “attributes” that assign names, numbers of acres, numerical measures of reflectance, demographic statistics as in census numbers, etc. Geospatial data has its own unique statistical operations that can be combined with well-known statistical techniques. All this can be in 2D, 2.5D, or 3D, and illustrated over time.
No, it is not different: Geo-spatial data is not a “picture,” but is highly structured data. Geo-spatial data may be transformed into a picture once it has been rendered as a map. Geo-spatial data can be saved as almost any type of image format, e.g. jpeg, gif, pdf, png, etc. Conversely, even pictures or pdf files can be referenced with geographic locations. Spatial data and attribute data are inseparable when conveying information. Attributes may be other tables in a database or imported from Excel, etc. All the factors of geo-spatial data must be managed like any database system using models, quality control, testing, and maintenance. Any process applied to database management must be applied to geospatial data as well as account for geospatial data’s unique conditions. Geo-spatial data can be stored in Oracle, IBM, SQL Server, PostGRIS, and other databases. Geo-spatial data and functions can be delivered as webservices with SOAP and REST or other formats. Geo-spatial data can be transformed into XML (GML and KML), JSON, and Graph formats. Once rendered as a map, Business intelligence applications can be created with dynamic reports and dashboards to query by filter or by the map.
Policy: Last weekend at a political science conference I discussed this and ran into the age old question whether geospatial data and mapping are just “tools” or make their own contribution to public policy. In 1493, Spain’s creation of a government GIS office was not just a tool of “New World” colonization but shaped where, how, and on whom it was applied. The Spanish gave a geography questionnaire to indigenous groups to fill out in order to test their humanness. I contend that the creation and use of GIS is part of policy formulation and implementation process as is any technology. Technology choices can be used as symbols of policy failure or success by people and groups that disapprove or approve of a policy in general. When bad data, geospatial or otherwise, leads to failure of policy implementation, the technical problems are not the first to be publicized, but the “failures” of an entire agency, program, management, or political leadership are. When bad policy and poor decisions are made, then in a rush to find a technological fix, an under-performing agency is given more money to fix the probable failure of the technology anyway. Like other technologies, geospatial data and applications can be made scapegoats of policy failures; or an agency and programs made scapegoats of undisclosed technical failures. Geo-spatial technology, especially because it emerged from the humanities, is no less solely a tool than is grammar.
Dennis Crow is part of the GovLoop Featured Blogger program, where we feature blog posts by government voices from all across the country (and world!). To see more Featured Blogger posts, click here.


Leave a Reply
You must be logged in to post a comment.