![]()
How can we better serve data users with different needs? This is just one question that drives a lot of the work we do at the Census Bureau.
Web applications, which present information in visually appealing and interactive ways, are a great way to serve the needs of many customers. These apps allow you not just to open up your data, but to present it in a format specifically designed for a particular customer segment.
For example, our Web apps enable Census Bureau customers to quickly find information. Whether it’s to write a business plan, to track economic change or even to understand a region’s transportation growth. Our customers’ practical needs for our data are huge, and Web apps allow us to ensure those needs are met, regardless of how vast they may be.
We’ve created about two dozen apps that channel data from hundreds of official surveys and, in some cases, other sources. Along the way, we’ve learned a few things.
Know Your Strength
It’s entirely possible for a Web tool to be too powerful, giving people more information than they want or need. Take American Fact Finder, for example. This Web application allows a user to download data from any of our surveys. Our expert data users love it because it gives them direct access to the full power of our data sets. However, the app and its robust functionality can be overwhelming for someone who needs a single piece of data.
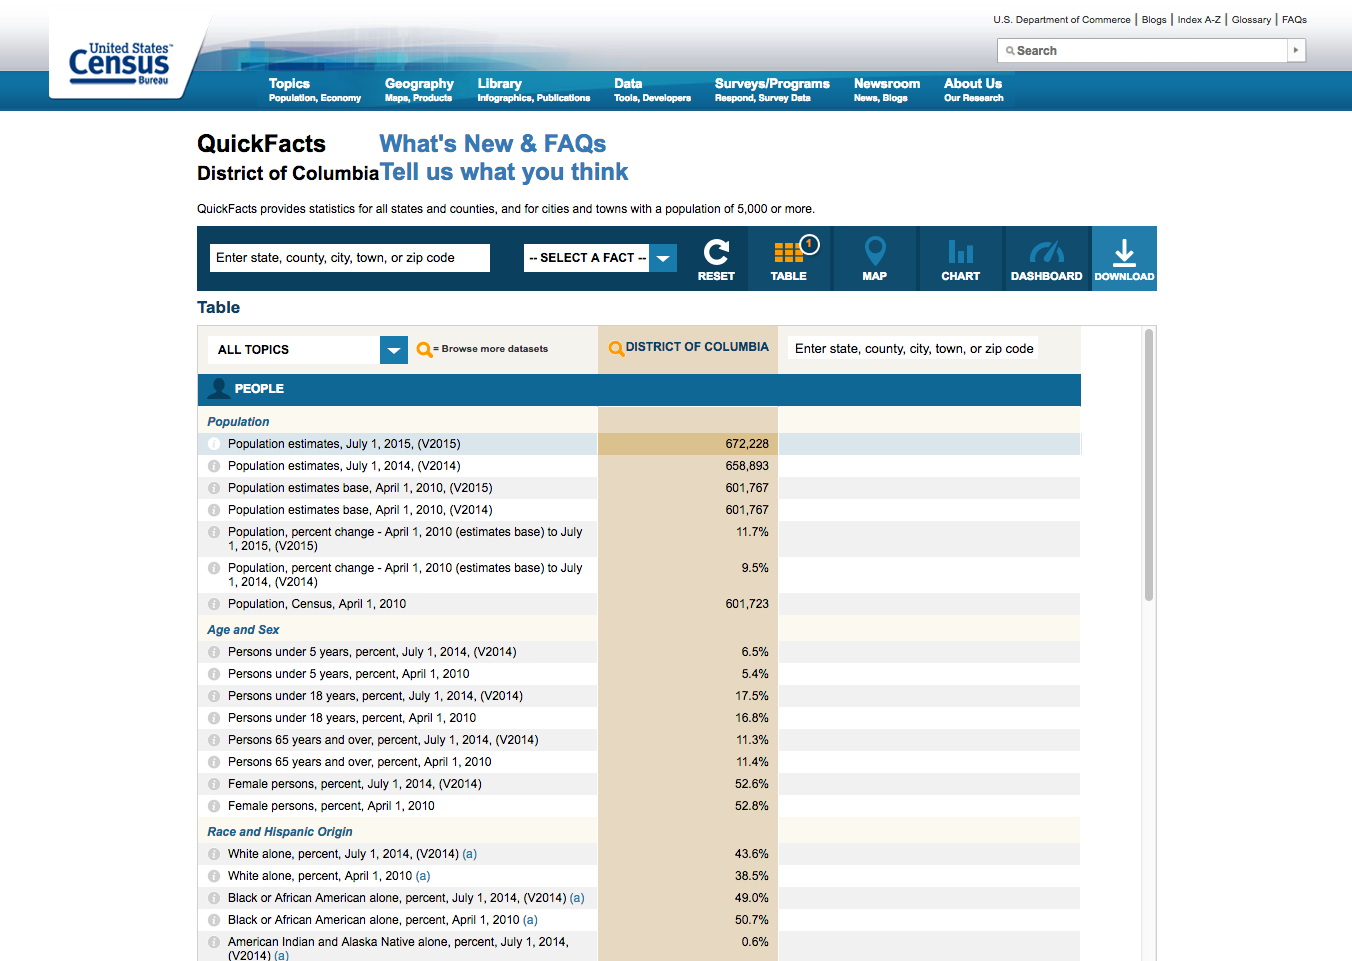
To meet the demand of our more novice users, we deployed a Web app called QuickFacts, which displays popular profile information for a given geographic area. As its name implies, QuickFacts is designed to navigate users directly to the information they’re looking for. Interactive and visually appealing, it has key elements for the average Census.gov visitor, though it may not be as enticing for expert data users.
QuickFacts also includes an embeddable widget, giving customers the opportunity to simply bring our data to their websites. For us, that means the potential to reach a wider audience. For our customers, it’s a tool that’s both portable and easy to use.
Customers Need Tools, Not Just Data
I’ve talked about apps for the expert user (American Fact Finder) and those for the novice user (Quick Facts). But the Census Bureau also needed to reach users who fall somewhere in the middle. These are users who need specific information, but not necessarily something as complex as a full data set to download and use.
Entrepreneurs, for example, sometimes fall under this category. Census data can help them with creating a business or marketing plan, or making decisions such as where to open a new location or how to more effectively reach target customers. In the past, entrepreneurs not only had to know what data we collected, but they also had to know which survey would have that data — and it is no surprise that most people aren’t on a first-name basis with our surveys.
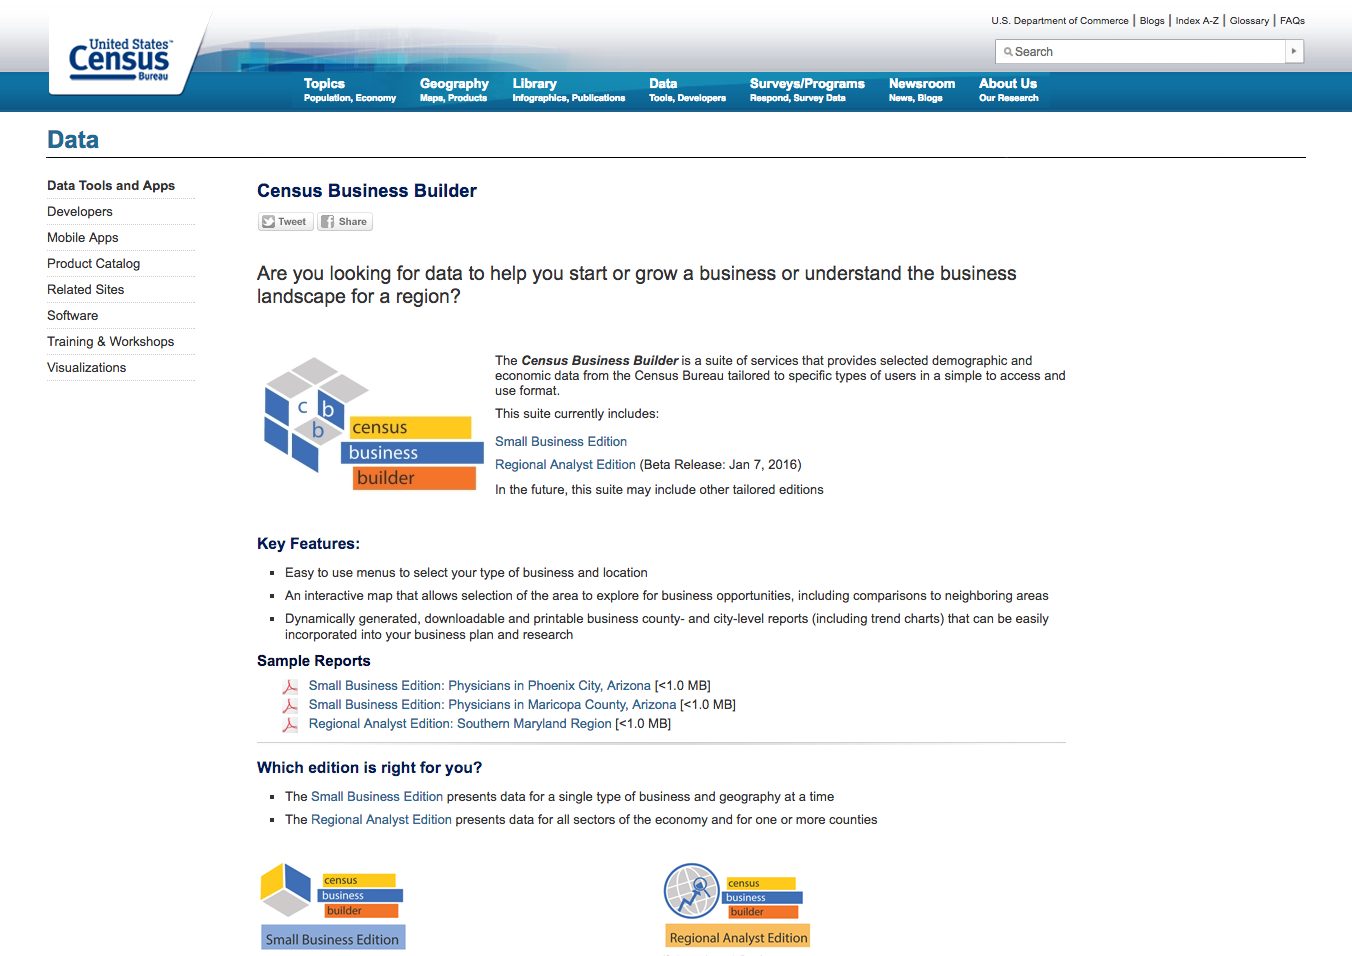
Entrepreneurs really needed their own tool that aggregated data from a variety of surveys, giving them the exact information they needed, and even mapping it out. Our new Census Business Builder app does just that. Thanks to our mapping partner, Esri, entrepreneurial customers have access to downloadable demographic and economic data in the form of a mapping interface, which is what businesses need because it is always about location.
Let Innovation Lead to Innovation
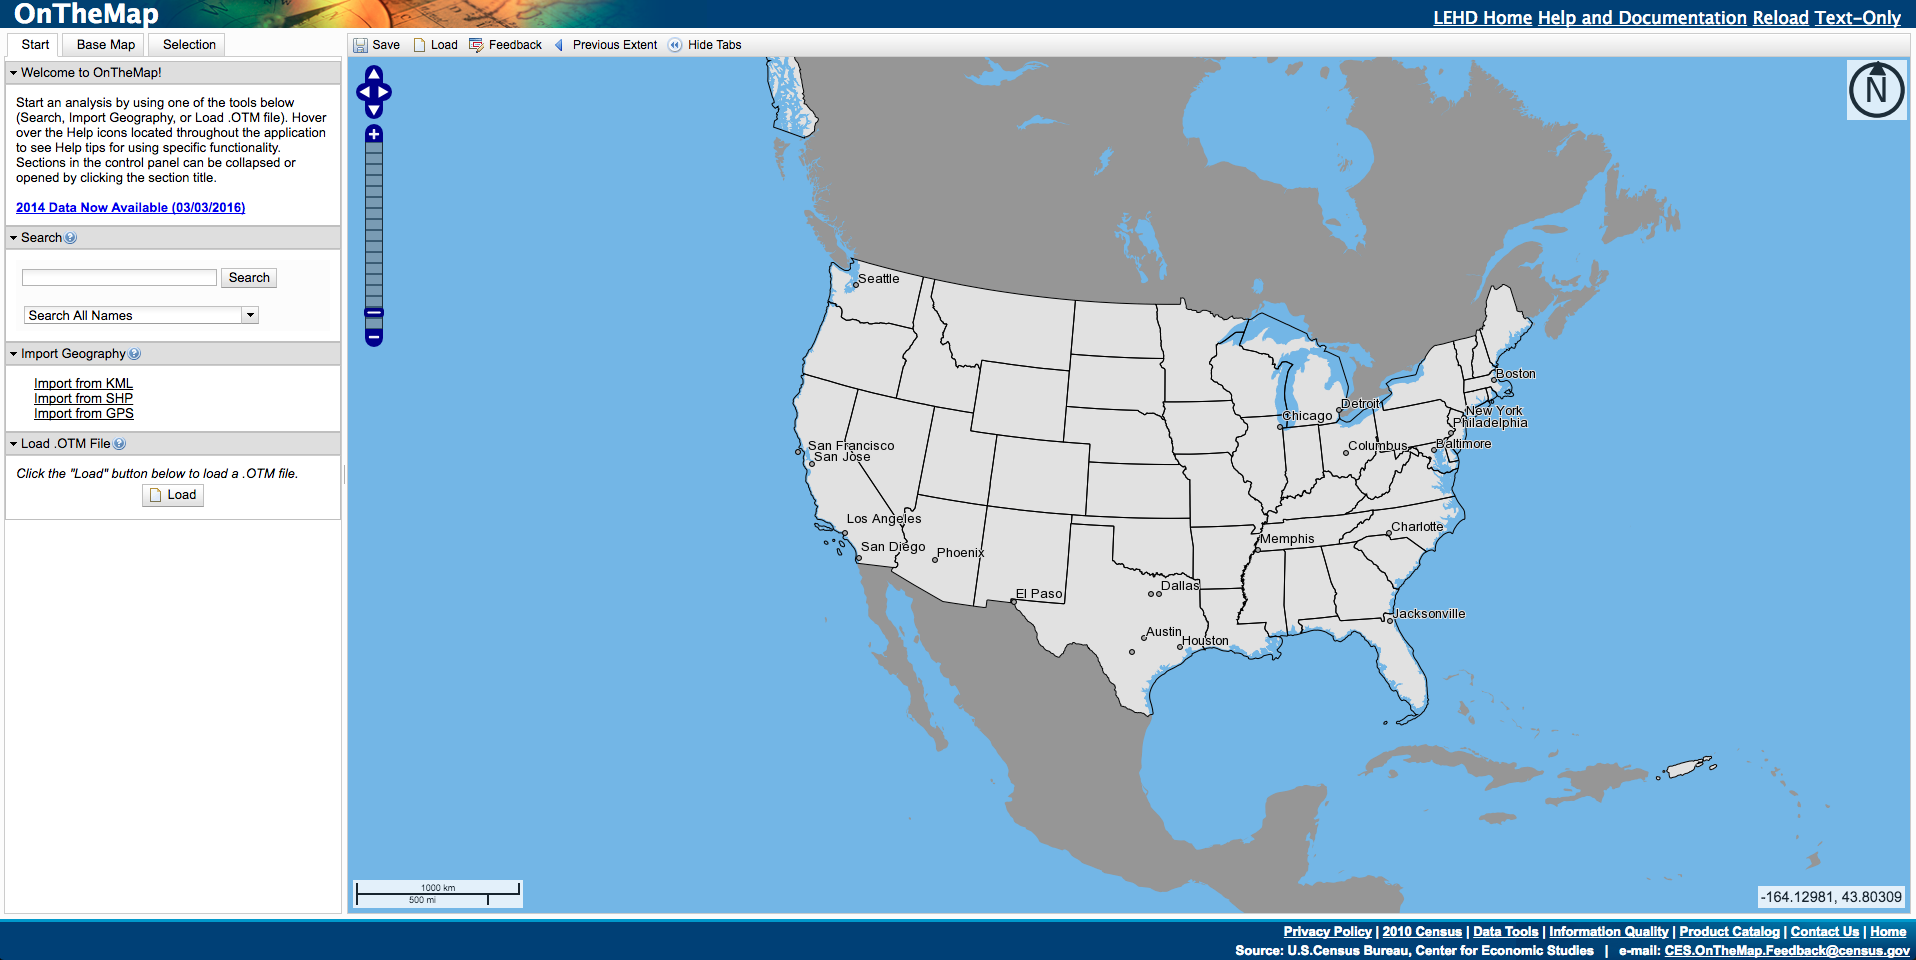
Our researchers are constantly looking for new ways to collect, combine, display and disseminate data. One project has been years in the making: Longitudinal Employer Household Dynamics (LEHD). It pulls together Census and state government data to chart the flow of jobs in local areas, including where new jobs are being created and where they are going away.
Conceived and constructed over several years in the research division of the Census Bureau, with the collaboration of 50 state employment agencies, the project pulled together data sets from across the country. After LEHD’s initial creation, we had to figure out how we could deliver this data as an experience to our customers. Enter On The Map, a tool that allows users to investigate data we aggregate from our own surveys and official records from each state, simply by scrolling over different areas.
Some Roads Are a Dead-End, and That’s OK
Once you roll out a Web app, like any product, plan to evaluate its performance. Even the best analytics and customer feedback can lead to a product that customers don’t use as you thought they would. Once you reach that point, you can tweak the app to be more useful, or retire it and cook up something new that better meets customers’ needs.
At the end of the day, if you’re a customer-centric organization, everything you do should be with the customer in mind. If you can’t identify the target user, why build the app? Keeping track of what is best for your agency, while ensuring that your customers have a positive user experience with your products and services, is key to maintaining a great customer-agency relationship. Web apps can be an ideal way to offer tools that make the best use of your data while delivering a service customers really want and need.
Stephen L. Buckner is part of the GovLoop Featured Blogger program, where we feature blog posts by government voices from all across the country (and world!). To see more Featured Blogger posts, click here.




Thanks for sharing what you’ve learned! Very helpful!
Thanks Katarina.