

Qualitative and quantitative data serve distinct purposes and work best when considered
The What
When mentioned without a qualifier, “data” typically refers to quantitative data. That is, data collected from a large number of people that typically looks at the what of a problem (for example, “What do people do on the USPS website?” Or, “What is the median age of people purchasing National Parks passes?”) Large quantitative data sets are useful because they give us insight into populations that are more than one-off or anecdotal observations. However, quantitative data doesn’t answer all of our questions.
The Why
Qualitative data usually has a smaller sample size than quantitative data sets, but collects more (and usually more complex) data points from each person. Qualitative data often tell us why something is happening (for example, “Why do people visit the USPS website?” or “Why do people under 30 purchase the most National Parks passes?”) Qualitative and quantitative data together provide a holistic view of the questions we’re asking. Unfortunately, qualitative data is often cast aside in favor of quantitative data for faulty reasons.
Let’s take a look at some common misguided qualms about qualitative data.
“Your sample size is too small!”
Quantitative data examines patterns within and across populations, which allows for generalizations. Without a reliable and well-sampled survey group, it’s difficult to confidently generalize your results to a large population (that you haven’t sampled). But qualitative data doesn’t aim to generalize its findings across populations. Instead, qualitative data aims for depth (our why). Human behavior is complex and is impacted by many societal, cultural, and environmental variables. By gathering more data from each person, we can better understand the circumstances that led to their choices, preferences, and experiences.
A hot topic in user experience (UX) research is about the oft-cited Nielsen Norman Group guidance that 5 to 8 participants in a usability study is sufficient. This understandably ruffles quantitative researcher feathers, since this would be unacceptable in most quantitative studies. But there are two crucial caveats to the “5 to 8 participants” guidance that are rarely mentioned:
- This guidance is for qualitative usability studies (which is most standard usability studies) looking at variables such as task completion, user expectations, user paths, and recovery from errors.
- Our goal in usability studies isn’t to only fix issues that many people experience. Sometimes, one participant can encounter a severe issue that needs to be fixed (like a dead link), even if no other participants experienced it.
“This Data is Subjective!”
This is a short one: Both qualitative and quantitative data can be subjective; subjective data is not bad data, since subjective experiences impact how and why people use the things we are researching. Instead of seeing quantitative and qualitative data as polar opposites, we can consider them each a spectrum that includes subjective and objective collection methods.
For more information on the qualitative-quantitative data spectrum, Indi Young has written extensively about this topic and has a helpful visualization to accompany it.
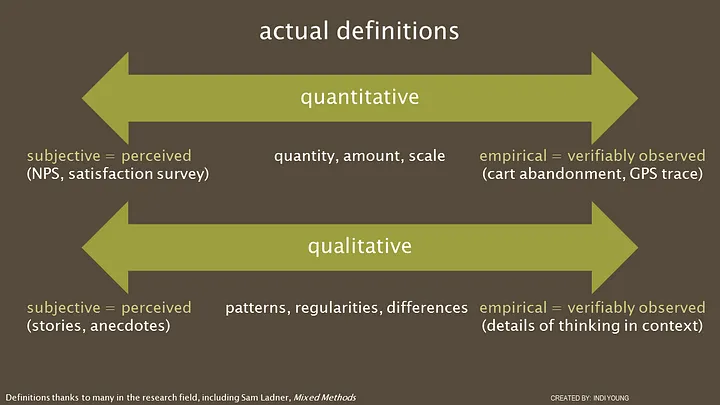
Indi Young’s helpful data spectrum visual from this Medium article on why organizations avoid qualitative research
“Let’s Just Ask Why in a Survey!”
Asking people why they do things in a large-scale survey format is possible and frequently done in research. However, it lacks one of the main benefits of qualitative research: depth. When we are interacting with someone in real time, we can ask follow-up questions, clarifications, and pull on interesting threads to learn more. We can’t do this with surveys, unless we wanted our survey to look like this:
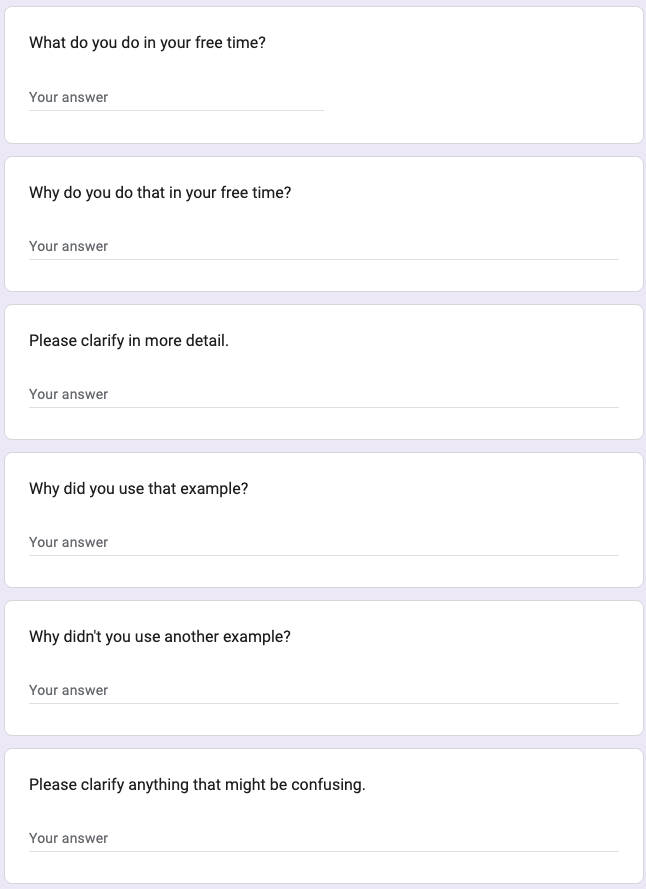
Hyperbolic, but not entirely unrealistic version of attempting qualitative research via surveys.
“Data” should not mean quantitative by default. Combining data methods and other insights disciplines in our studies helps us gain a more robust view of the populations we serve.
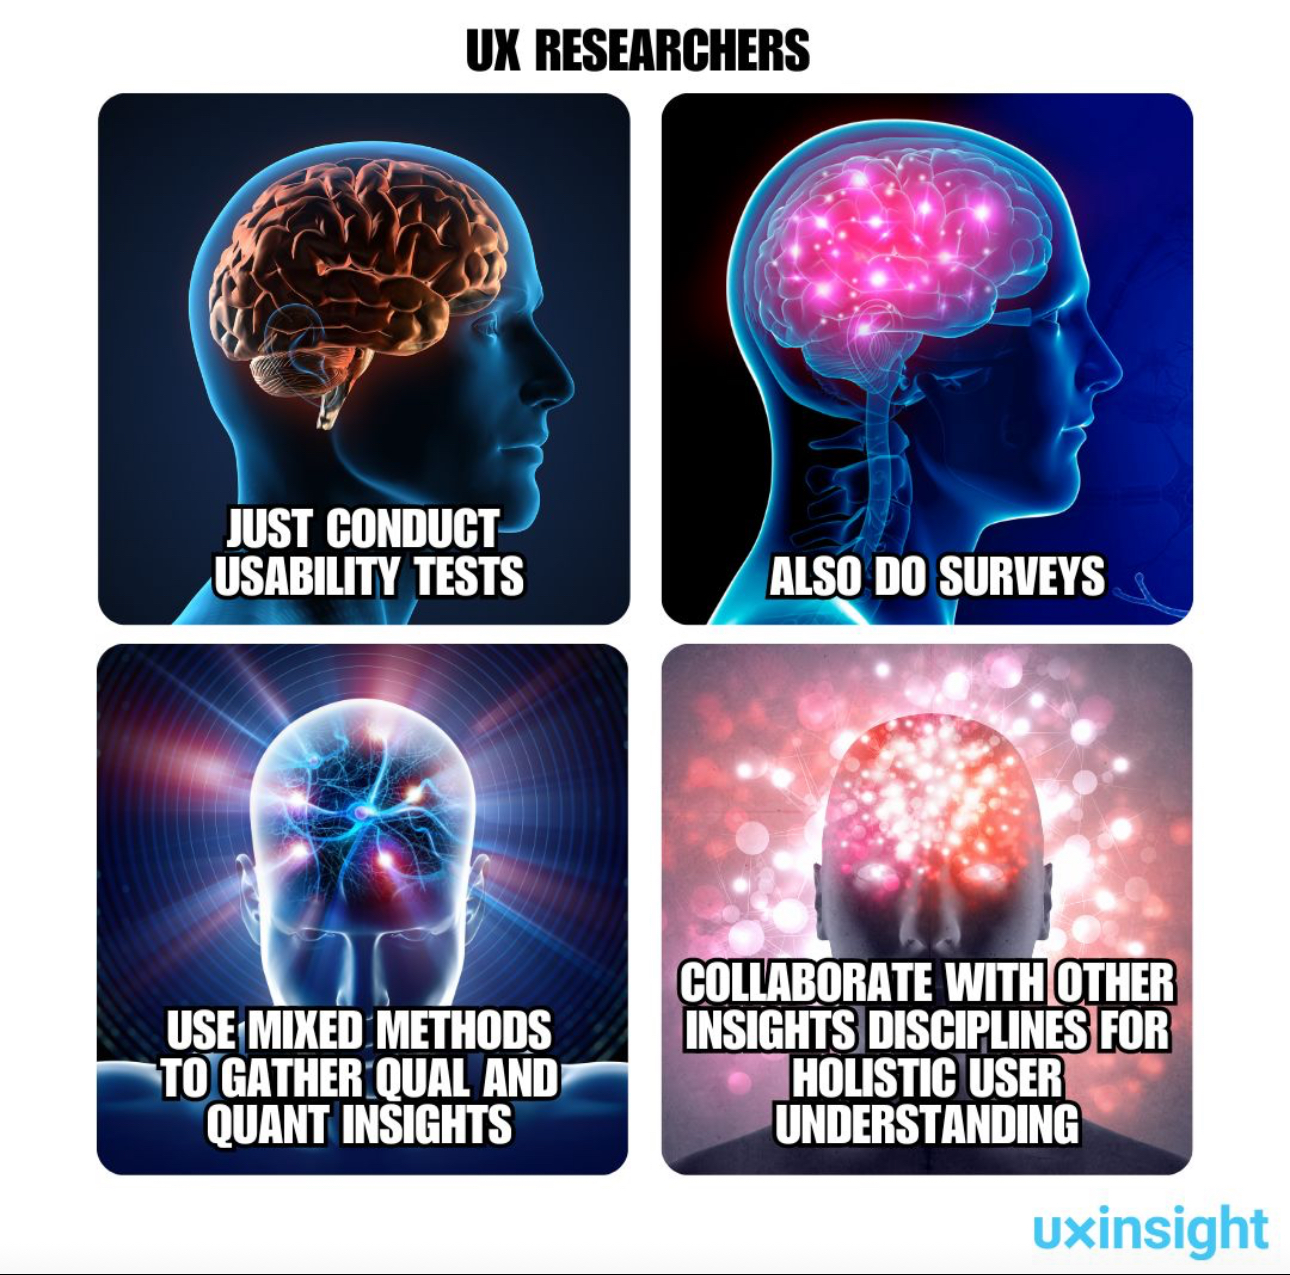
A visual summary of this entire article posted to the UX Insight community forum
Ann Aly (pronounced like Ali) is a UX and civic tech practice leader with a background in academic research, music, and education. She combines these experiences to lead teams improving federal government services, emphasizing communal leadership and transparency. Ann holds a PhD and MA (both in Linguistics) from UCLA, and an MA (Spanish and Portuguese) and BA (Music) from Florida State University. When she’s not asking too many questions, Ann enjoys woodworking, gardening, and exploring the Shenandoah Valley woodlands near her home.


Leave a Reply
You must be logged in to post a comment.