Geography, the science of our world, coupled with geographic information systems (GIS) helps us understand the Earth. We can apply this geographic knowledge to a host of human activities.
Last night, we learned how to expand our domain expertise into the world of scientific data management, modeling and analysis.
Science practitioners and GIS professionals came together for a GovLoop and Esri meetup, Putting GIS to Work within the Scientific Method. Our panel of experts included:
• Matt Poti, National Oceanic and Atmospheric Administration
• Brett Rose, PhD., Esri National Government Sciences
A few topics were discussed during this training including leveraging GIS for developing scientific models, analyzing and visualizing scientific data, and communicating outcomes easily and effectively.
Matt Poti kicked off the evening sharing his experiences using spatial predictive modeling by developing a new method for integrating proximity to seamounts. As a spatial ecologist he has made big waves with this new method.
GIS has helped him refocus his efforts to spend more time performing scientific work – developing models, making predictions, and driving break-through discoveries – rather than processing data.
In order to perform scientific work, he learned that it’s expensive to do surveys, so he is now able to do a biographical assessment to find out what data is available, and develop products that can be used to inform the public.
He went into detail on his spatial predictive modeling primarily of deep-sea corals and the proximity to Hawaiian seamounts. Spatial analysis, using GIS and Python, allows him detect patterns and assess risk. This enables his understanding and allows him to derive better insights.
Brett Rose followed up with explaining how to do more with your scientific data. He discussed visualizing and analyzing time-enabled multi-dimensional data, integrating R into GIS, presenting output and results in easy-to-understand ‘stories’, and making complex data available as real-time services.
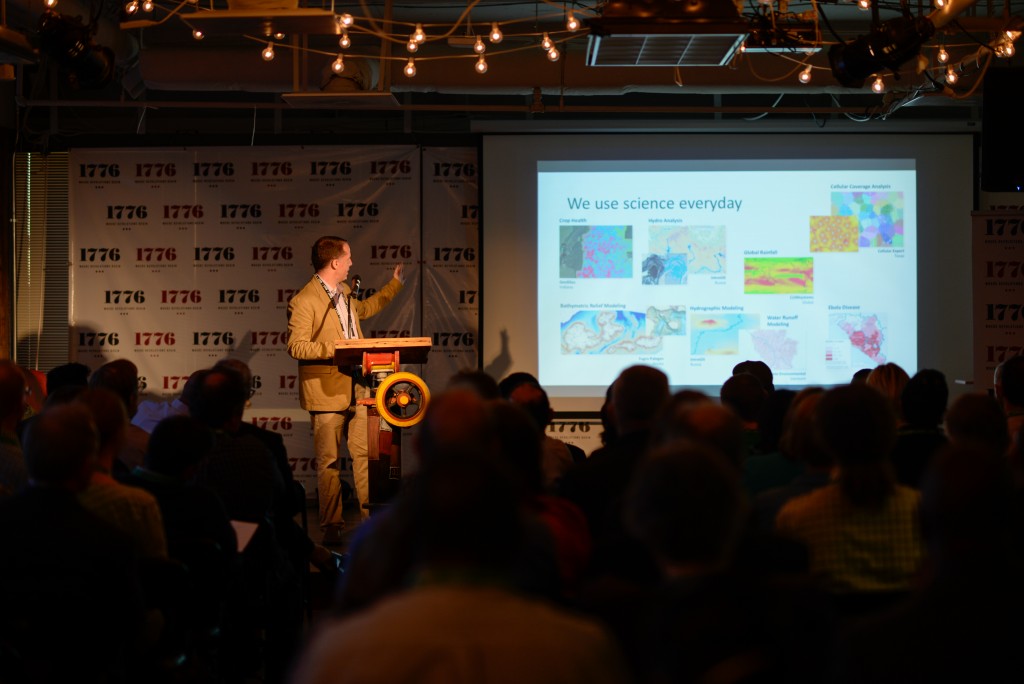
“Everyday we do science,” Rose stated to start off his presentation. “We are constantly making observations.” He set the stage for a talk about the languages data scientists use to make these observations and the language used to share observational findings.
He then introduced the “Scientific Toolkit”, which uses technology to leverage and engage with observation systems and smart ways to collect data in the field.
With these data findings, professionals need to communicate science by telling stories about their research so that people understand their work better. The crowd, full of fellow data scientists, agreed that it’s important to communicate this science more widely. One successful way to explain your data is through story maps.
He then explained data science, which is about the application of statistics and machine learning to real-world data, and developing formalized tools instead of one-off analyses. He also did a deep-dive into the languages commonly used in data science including R, Python, Julia, and Matlab, and Esri’s ArcGIS platform. The ArcGIS platform has rich tools and applications that help solve a wide variety of real-world problems by integrating geographic information into how we understand and manage our planet. These tools have transformed the way that practitioners in the field can map data.
The event concluded with a networking reception where attendees spoke GIS with one another while experiencing hands-on demos of this technology at work. The unique blend of scientists and GIS professionals that the event brought together created a room full of stimulating conversations about the future data science thanks to GIS innovation. Rose gave science professionals a look into more of the GIS system itself, opening the eyes and minds of everyone in the room.
Poti provided an amazing testimonial of how GIS has transformed his ability to do his job better. Thanks to GIS, scientific professionals can do more with their data and agencies can refocus their efforts on performing scientific analysis and communicating its outcomes.
To learn more about the Scientific Toolkit and data science, check out the slides here.
